The Top Five Most Useful Commands in Pandas
Dec 21, 2019 13:52 · 589 words · 3 minute read
 Photo by
 You’ve just started learning data science, you’ve got your data in a dataframe, now what?
I’d love to introduce you to the commands that I use the most with Pandas to help you discover insights in your data even faster. I will assume you have a dataframe in your code called df.
Head
Every time I read data into Pandas, the first thing I do is use the head command to view the first 5 rows of data. This will produce output similar to:
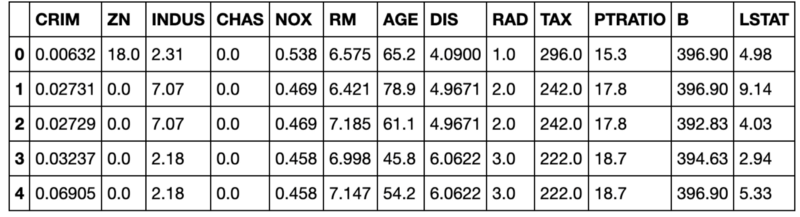
You run the command with df.head().
I find this incredibly valuable because it allows me to sanity check that the data were read in correctly, see what columns I have, and get a quick sense of the values for the various columns. The downside to this command is that it doesn’t scale very well to datasets with many columns.
Describe
After using the head command, the next command I turn to is describe. Describe will give you the mean, standard deviation, and various percentiles for all of your numeric columns. Here is an example of the output:
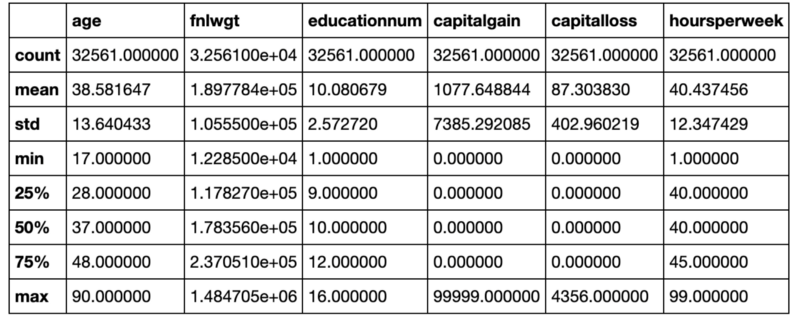
Just like the head command, you run this command with df.describe().
This is a quick way to understand the distributions of all of your numeric data. It also usually makes any serious outliers or data problems obvious. For example, if our maximum age was greater than 125 then we would know we have some type of data problem.
Value Counts
Since describe only works for numeric data, I usually turn to the value_counts command to better understand the categorical columns. If you have a column called ‘relationship’, you can get the value counts with the following command:
df[‘relationship’].value_counts()
And it would produce output like the following:
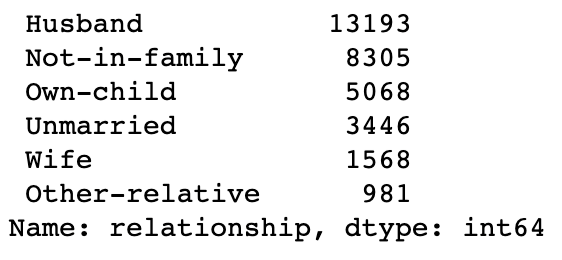
From this, we can see the count of the values for our relationship column. We have many Husband relations, but very few Other-relative. This not only helps us sanity check our data, but also understand the data we have.
Corr
Now that I have a sense of my data, I usually turn to the corr command to understand what correlations I have. It is particularly useful to include the value you are trying to predict in your dataframe, so that you can see the correlation of your potential features with your labels.
When running df.corr(), you get the correlation between all the columns in your dataframe like so:
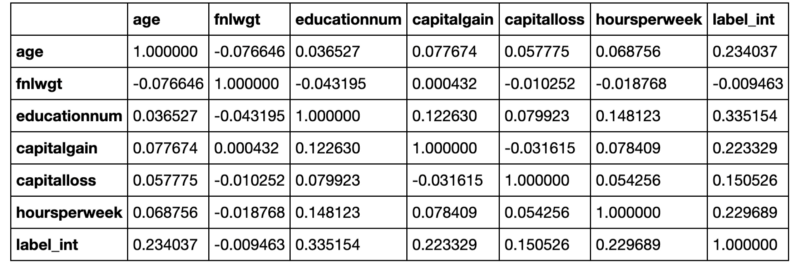
In our example output above, our label is “label_int.” We can see that “educationnum” is the most positively correlated variable and thus might make a good feature. “Fnlwgt” on the other hand has almost no correlation with our label.
GroupBy
Lastly, I tend to find it very useful to slice and dice the data by groups using the groupby command. For example, if I wanted to see the average hours worked per week by work class, I could run the following command:
train_df.groupby([‘workclass’])[‘hoursperweek’].mean()
Which would produce:
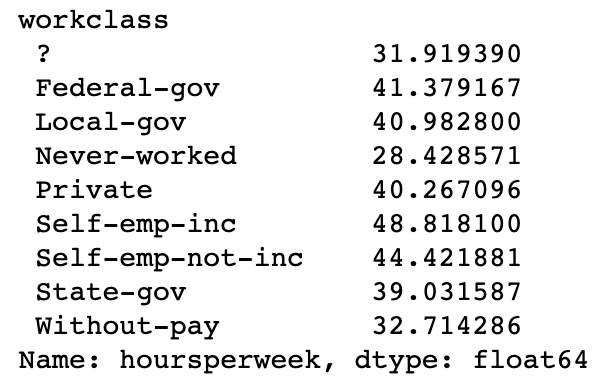
We can see that the “Self-emp-inc” group works the most hours on average and that the “Never-worked” group works the least amount of hours. I am not sure how a group that has never worked has worked any hours at all, but that is a discussion for another time.
Go Explore Your Data
I hope this article has helped you understand my most used Pandas’ commands and why I use them so much. If you would like to learn more about these commands, or others, please make sure to check out the Pandas’ documentation!
Join my email list to stay in touch.